How to Check Disk Free Space on Linux
Checking and managing free space on your system disk is...
When troubleshooting network issues on Linux, having a reliable diagnostic tool can make all the difference. MTR (My Traceroute) is a dynamic utility that empowers users to monitor and analyze network performance effectively. By combining traceroute and ping functionalities, MTR maps out the journey of data packets while highlighting critical details such as delays and packet loss.
For Linux users, MTR is a valuable tool to uncover the root causes of connectivity problems. Its interactive reports provide actionable insights, enabling administrators to identify weak links in the network path and address them promptly. Whether dealing with latency, routing errors, or packet drop, MTR ensures you have the data needed to optimize your network.
In this guide, we will explore how to install MTR on Linux, from installation to report generation. By the end, you’ll be equipped to resolve network challenges with confidence and efficiency.
To generate an effective MTR report on Linux, you need to start by ensuring the tool is properly installed and configured on your system. Linux distributions typically provide MTR through their package managers, making installation straightforward.
For Debian-based systems like Ubuntu, you can install MTR using the apt package manager:
sudo apt install mtr -y
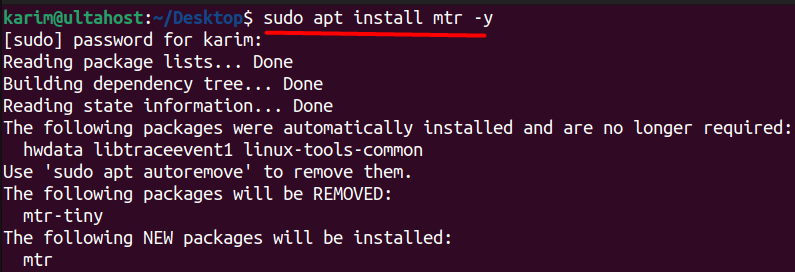
You can use the similar command on other Linux distributions as well using their respective package manager.
The basic syntax of MTR is simple yet versatile. To initiate a network trace, you can type the below command in the terminal:
mtr <hostname> or mtr <IP address>
Replace <hostname> or <IP address> with the destination you want to analyze, such as a website or a specific server. For example:
mtr www.google.com
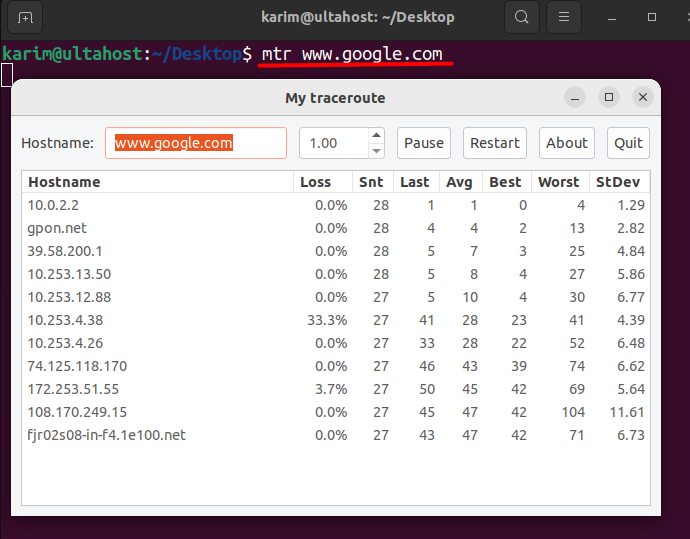
After executing the command, MTR starts providing a real-time overview of the route packets take, listing every hop and displaying metrics like round-trip time and packet loss for each one.
Generate Report Using MTR with Our Linux VPS!
Ultahost’s Linux VPS offers complete control and flexibility, making it an ideal platform for working with Linux commands like ulimit.
Creating an MTR report is a straightforward yet powerful way to diagnose network issues. MTR provides several options to customize reports according to the user’s needs. Each option enables different functionalities, making MTR versatile for a range of diagnostic scenarios.
Below, we explore the commands and options required to generate detailed reports.
The -r option activates report mode in MTR. This mode collects data over a specified number of cycles and outputs the results in a static format. To generate a basic report, use the command:
mtr -r www.google.com
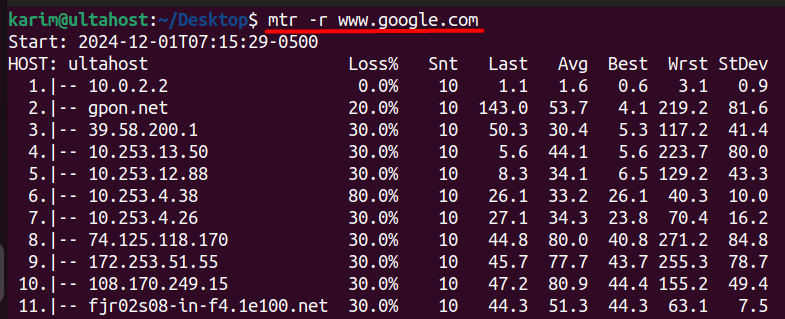
This command runs MTR for the default number of cycles (10) and provides an overview of the network path, including metrics such as packet loss and average latency.
By default, MTR runs for 10 cycles, but you can adjust this using the -c option. For example, to run MTR on linux for 20 cycles, use the command:
mtr -r -c 20 www.google.com
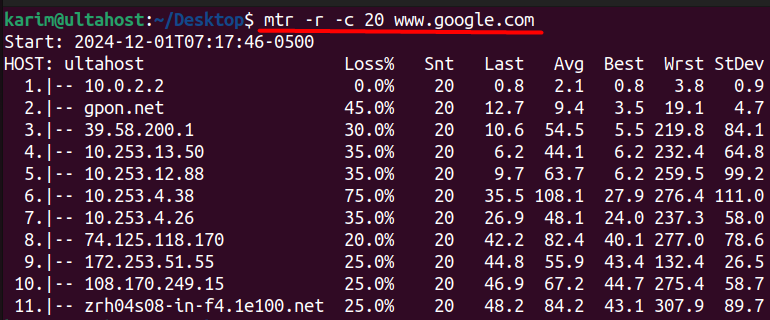
This allows for more detailed data collection, which is particularly useful when troubleshooting intermittent network issues. Increasing the number of cycles provides a broader dataset for analysis.
The -w flag enables wide format output, which includes additional metrics such as standard deviation in latency. This format is helpful for users who need a comprehensive view of network performance. To generate a wide-format report, use the command:
mtr -r -w www.google.com
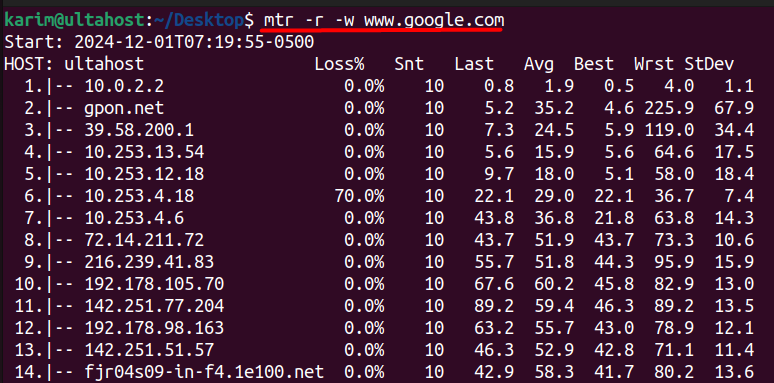
The added metrics can provide deeper insights, especially in scenarios where latency fluctuations are a concern.
By default, MTR uses ICMP packets for testing, but you can switch to TCP packets with the –tcp option. This is useful for diagnosing issues related to applications that rely on TCP connections. To generate a TCP-based report, use the command:
mtr -r --tcp www.google.com

This option ensures that the diagnostics reflect the behavior of services like HTTP or SSH, which use TCP for communication.
To save MTR results for later review or sharing, redirect the output to a file. For example, the following command saves the report to a text file named `mtr_report.txt`:
mtr -r -c 10 www.google.com > mtr_report.txt

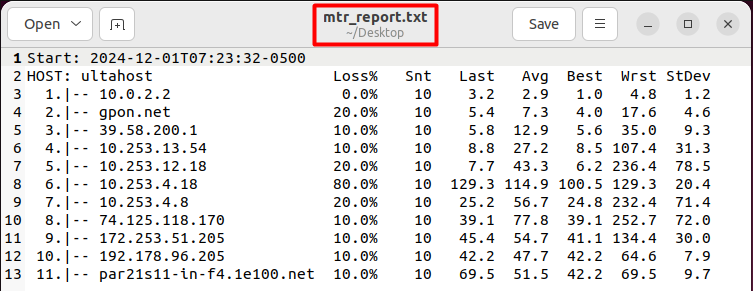
This functionality is particularly useful when collaborating with other teams or service providers, as it allows you to share detailed diagnostics efficiently.
The -p option activates split view mode, which displays both ping and traceroute data side by side. This allows for simultaneous analysis of packet delay and route changes. To use split mode while generating a report, run:
mtr -r -p www.google.com
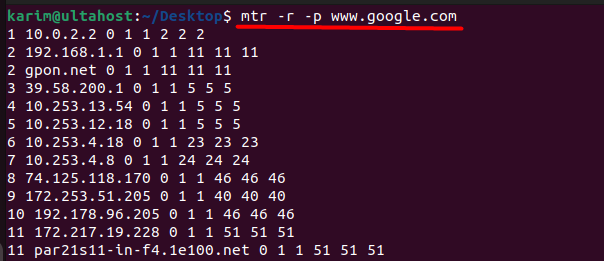
This feature is valuable when diagnosing complex issues involving both latency and route stability.
Learn also How to Generate Report Using MTR on Windows.
You can combine multiple options to tailor MTR reports to specific requirements. For example, to generate a wide-format report with 20 cycles using TCP packets, the command would be:
mtr -r -w -c 20 --tcp www.google.com

This flexibility makes MTR a robust tool for advanced network diagnostics.
MTR is a great tool for identifying and troubleshooting network issues with precision. Its dynamic combination of ping and traceroute allows users to uncover a wide range of network performance problems. Below, we explore how MTR aids diagnostics through specific aspects.
One of MTR’s primary functions is detecting packet loss, which can disrupt data transmission and degrade performance. By analyzing the percentage of packet loss at each hop, MTR pinpoints the exact node or link causing the issue. Persistent loss at a particular hop indicates a potential fault in the corresponding network device or route.
MTR provides detailed latency metrics, helping users identify delays in network communication. Consistently high latency at a particular hop often signifies congestion, routing inefficiencies, or physical distance. Comparing latency across hops reveals problematic nodes or bottlenecks.
During diagnostics, MTR detects route changes dynamically. These changes can indicate unstable paths or misconfigurations in the network. Observing sudden shifts in hop addresses helps users understand the behavior of dynamic routing protocols or ISP-level adjustments.
MTR is a versatile network diagnostic tool that combines the strengths of ping and traceroute, making it indispensable for analyzing connectivity issues. On Linux, it provides users with robust capabilities to generate detailed reports, offering insights into packet loss, latency, and the routing path. By using various options and flags, such as -r, -c, and –tcp, users can tailor reports to meet specific diagnostic needs and share findings effectively.
Through practical commands and customizable features, MTR simplifies the troubleshooting process for both IT professionals and casual users. Whether diagnosing packet loss, identifying latency issues, or observing route changes, MTR empowers users to address and resolve network challenges efficiently. Mastering this tool equips Linux users with a reliable method for ensuring stable and optimized network performance.
We hope this guide has helped how to generate reports using MTR on Linux. For a faster and smoother coding experience, consider using Ultahost’s quick VPS hosting. With dedicated resources and instant access, Ultahost ensures reliable performance for even the most demanding development tasks.
MTR (My Traceroute) is a network diagnostic tool that combines traceroute and ping to analyze connectivity issues. It helps identify packet loss, latency, and routing inefficiencies.
You can install MTR using your Linux distribution’s package manager. For example, use sudo apt install mtr on Debian-based systems or yum install mtr on Red Hat-based systems.
The basic command is mtr <hostname>, where <hostname> is the domain or IP address you want to analyze. This provides real-time network diagnostics.
Use mtr -r -c 10 <hostname> to generate a report with 10 cycles of data. You can redirect the output to a file for sharing or further analysis.
Yes, by adding the –tcp flag to your MTR command, you can use TCP packets. This is useful for testing services like HTTP or SSH.
MTR identifies packet loss, tracks latency, and highlights route changes. It provides a detailed view of network performance, helping users locate and fix issues.
Yes, you can save the output by redirecting it to a file, such as mtr -r <hostname> > report.txt. This is ideal for documentation or collaboration.