In today’s digital world, engaging visuals are no longer a luxury. Hence, it’s no surprise that infographic creation sites and tools have become the go-to solutions for simplifying complex data, telling compelling stories, and attracting audiences’ attention.
So, whether you’re an experienced designer or a novice, these tools help transform raw information into visually stunning and shareable content. As we step into 2025, the demand for flexible and accessible infographic creation tools has soared. Let’s dive into the five best options to help you choose.
What Factors Should You Consider When Comparing the Best Infographic Creation Tools?
Here are five key factors to consider when choosing the perfect infographic creation tool for your needs.
Ease of Use
Firstly, platforms like Canva offer intuitive interfaces paired with step-by-step guides. These features save time and ensure that even new users can create professional infographics without a steep learning curve. For Microsoft users, PowerPoint can also be a powerful tool to make infographics, by adjusting the presentation canvas from landscape to portrait.
Customization Options
Secondly, customization is critical for making sure your infographics align with your brand or vision. Tools like Visme allow users to adjust everything from fonts and color to animations, making each design truly unique. Similarly, platforms such as DocHipo offer advanced design elements and AI-driven features for text-to-image generation.
Pricing and Plans
Thirdly, budget plays a significant role in choosing the right tool. Free plans are a good starting point, with tools like Infogram offering basic functionality at no cost. However, for premium features like high-resolution exports or collaborative tools, you might have to buy a monthly subscription.
Collaboration Features
Fourthy, collaboration is essential in team environments. Hence, infographic creation tools like Venngage excel in this area, offering real-time editing and shared access. These features enable teams to brainstorm, make edits, and review designs together, improving project efficiency.
Output Formats
Finally, the ability to export designs in various formats ensures that your infographic is compatible with multiple platforms. Infographic creation tools like Canva offer flexible output options, including formats for social media. Thus, streamlining your social media marketing efforts.
5 Best Infographic Creation Tools Compared
Here are the five best infographic creation tools for your diverse needs in 2025. Consider
Canva
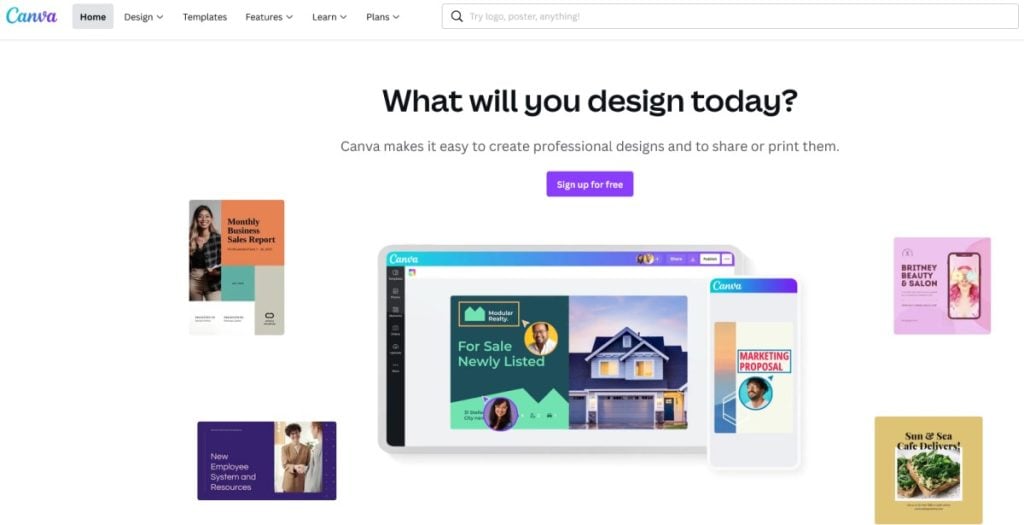
Canva stands out as a flexible and beginner-friendly infographic creation tool. Its drag-and-drop interface makes it simple to craft professional designs, even for users without prior experience. Moreover, Canva’s collaborative features allow multiple team members to edit projects in real-time. It’s the most popular tool among eCommerce brands with an active blog.
Key Features
- Extensive Template Library: Canva offers thousands of templates catering to various industries and content types, from social media graphics to infographics.
- Collaboration Features: Teams can collaborate in real-time, making it easier to edit and finalize designs collectively. This feature is especially useful for marketing and design teams.
- Cross-Platform Availability: Canva is accessible on web and mobile platforms, and the infographics are SEO-optimized and work well with all responsive WordPress themes.
Pros
- Extensive design templates for all industries save time
- User-friendly interface suitable for beginners
- Seamless cross-platform availability on web and mobile
Cons
- Limited advanced customization options in the free plan
Piktochart
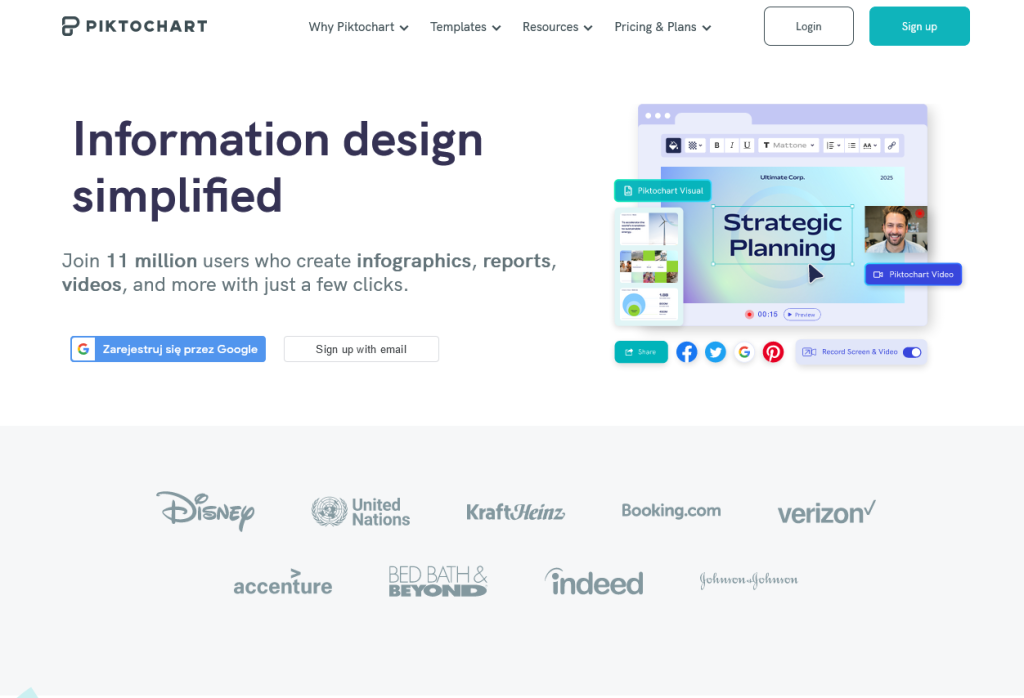
Piktochart specializes in transforming data into visually stunning infographics, making it ideal for educators, marketers, and business professionals. The tool features an extensive template library tailored for reports, presentations, and social media content. Hence, users can seamlessly integrate charts, icons, and images into their website hosted on any top-tier offshore VPS. Piktochart also allows for customization, from branding to layouts, ensuring unique outputs. Hence, it is perfect for anyone who wants to communicate data effectively and creatively.
Key Features
- Data Integration Tools: Piktochart supports direct integration of charts, graphs, and maps, making it ideal for data-centric infographics.
- User-Friendly Interface: Its drag-and-drop design system ensures ease of use, even for those with no prior design experience.
- Custom Branding: Paid plans enable users to create custom themes, ensuring infographics align with brand guidelines.
Elevate Your Business Website with Blog Hosting
Ideate, imagine and conceive on the fast lane. UltaHost Blog Hosting offers managed WordPress, blazing speed, and powerful security to boost your online presence.
Pros
- Tailored for data-centric infographics with easy chart integration
- Offers templates ideal for reports and presentations
- Allows custom branding for businesses
Cons
- Fewer advanced design elements compared to competitors
Venngage
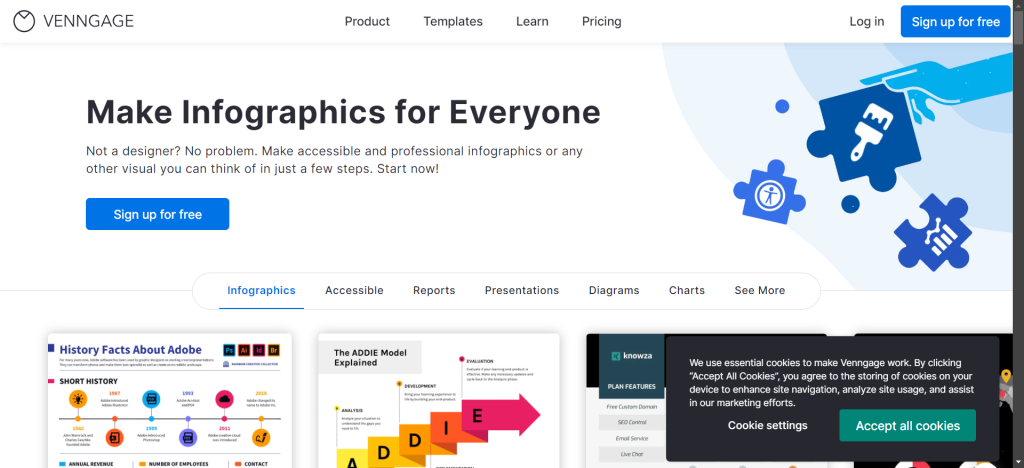
Venngage is a powerful infographic creation site designed for storytelling and data visualization. Known for its wide array of professional templates, it caters to business presentations, marketing campaigns, and educational purposes. Venngage simplifies complex processes with visual editing and prefab assets like charts and icons. Collaboration features enable team edits, making it suitable for corporate use.
Key Features
- Professional Templates: Venngage boasts templates tailored for presentations, reports, and marketing, saving time for users.
- Brand Kit Integration: Users can upload logos, fonts, and colors to maintain brand consistency across all designs.
- Interactive Elements: The tool supports interactive features like clickable links and dynamic charts, enhancing viewer engagement.
Pros
- Strong focus on professional templates for corporate needs
- Brand kit feature enhances branding consistency
- Supports interactive infographics for added engagement
Cons
- Higher pricing for premium features compared to other tools
Infogram
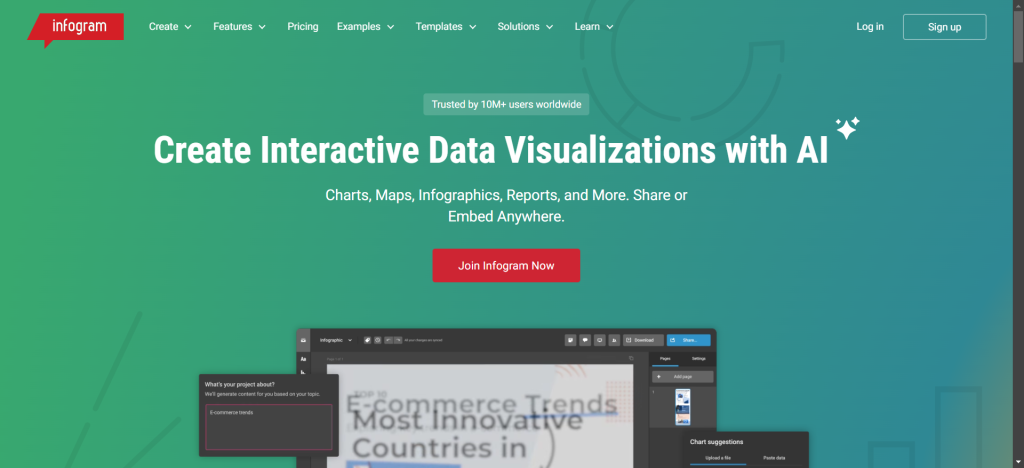
Infogram excels in creating factual visuals, including infographics and reports. Its highlight is the integration of immediate data updates, which is ideal for dropshipping and wholesale businesses looking to present evolving information. Users can access a variety of charts, maps, and interactive elements, and upload them to their high-traffic website or eCommerce store hosted on any reliable eCommerce hosting plan.
Key Features
- Data Visualization: Infogram integrates data updates immediately. This is perfect for dashboards and evolving reports.
- Interactive Infographics: Users can create interactive charts, maps, and reports, enhancing audience engagement.
- Live Collaboration: Teams can collaborate in real time, improving productivity and ensuring seamless project execution.
Pros
- Real-time data updates are ideal for live dashboards
- Interactive features like clickable elements improve user engagement
- Simple team collaboration functionality
Cons
- Steep learning curve for beginners unfamiliar with data visualization tools
Snappa
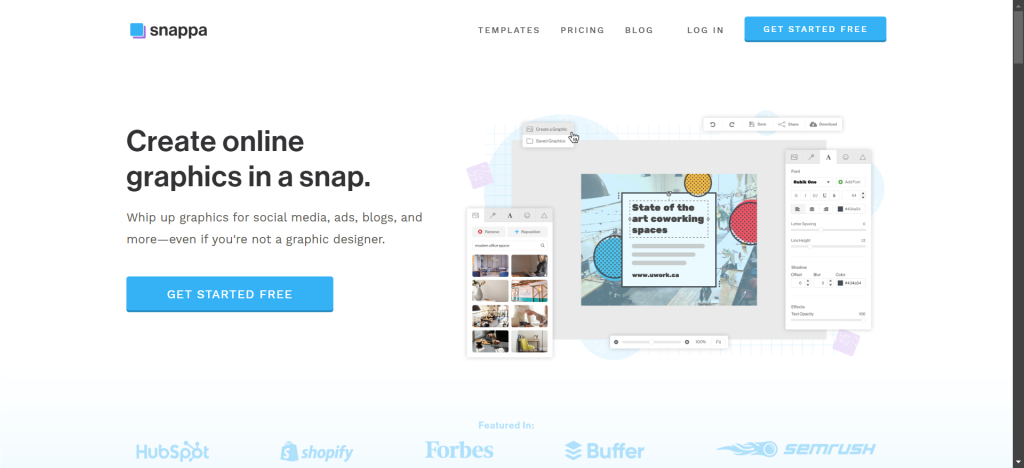
Snappa is an accessible infographic creation tool for creating quick designs. With its simple interface, users can start from scratch or choose from a library of templates improved for social media, blogs, and presentations. The platform includes access to a stock photo library, customizable fonts, and graphics. Snappa is an excellent choice for small businesses, marketers, and freelancers seeking fast, attractive visuals.
Key Features
- Simplified Design Process: Snappa’s convenient interface allows users to create graphics quickly with prefab templates.
- Extensive Stock Library: The tool includes access to fantastic stock photos, graphics, and fonts, perfect for professional designs.
- Affordable Pricing: Snappa’s premium plans are cheap, making advanced features accessible for freelancers and small businesses.
Pros
- Quick and simple design process with pre-sized templates
- Includes a wide range of stock images and graphics
- Affordable pricing for freelancers and small businesses
Cons
- Limited features for advanced designers compared to premium tools
Conclusion
That concludes our list of the top five infographic creation tools. In 2025, infographic creation tools continue to transform the way we communicate using images. Each tool offers unique features for different audiences, from new users to professionals. Whether you are looking for simplicity, collaboration, or customization, there’s a tool to match your needs.
Are you looking for a reliable web host for your WordPress website? Choose Ultahost’s Fastest WP Hosting solutions for 5x faster page load speed than rivals. Enjoy ultra-fast servers, NMVe SSD storage, and unmetered bandwidth, starting at just $2.87 per month.
FAQ
Which is the best infographic creation tool in 2025?
Canva is the best overall tool for its flexibility and ease of use for individuals and businesses.
How do I find the best infographic creation tools?
Evaluate tools based on your needs, like ease of use, templates, customization, pricing, and output formats, to pick the right fit.
Why do I need an infographic creation tool?
Infographic creation tools simplify visual storytelling, helping you communicate complex ideas effectively and engagingly, especially in data-driven fields.
What are the benefits of using an infographic creation tool?
They save time, improve audience engagement, and elevate your content’s professionalism with templates, graphics, and data visualization options.
Can I use AI to create infographics?
Yes, many tools like Canva and DocHipo integrate AI for features like text-to-image generation and smart design suggestions.
Which is the best site for infographics?
Canva and Venngage are top choices, offering robust design options for all your diverse infographic needs.
How much money should I spend on an infographic creation tool?
Ideally, you should spend as little as possible when starting your business. Once revenue increases, consider upgrading to a premium plan.


