


Choosing a WordPress host is confusing. Every single provider is throwing numbers at you. “Blazing fast.” “99.9% uptime.” “Unlimited bandwidth.” But here’s the plain truth, most of those claims carry little meaning absent context.
The more interesting question is not which host sounds the best. That is what your host actually does when your business rides on it. A slow website irritates visitors, not just customers. It kills conversions, and kills you in Google rankings, and chips away at the trust’s you build your brand.
So, in this guide we’re cutting through the noise. We will unpack the WordPress hosting metrics that really matter for your business. At the end, you will know exactly what to seek — and what not.
Key Takeaways
- TTFB under 200ms is the absolute gold standard in competitive WordPress hosting.
- Core Web Vitals (LCP, CLS, FID) are directly correlated with your Google search rankings
- 90+ Day Measured Uptime Not Percentage Advertised
- Monitor their performance under realistic load conditions — not just single-user tests.
- Security metrics (malware scans, DDoS protection, SSL) are a business priority rather than an extra.
- The geographic locations of your server and CDN can greatly affect page load times around the globe.
- Managed WordPress hosting usually crushes generic hosting on benchmarks.
Deploy WordPress with Confidence
Host on UltaHost’s Managed Infrastructure Built for Secure, Staged Updates.
The Importance of WordPress Hosting Benchmarks
Let’s begin with a number that should grab your attention. A Google study shows that a one-second delay in page load time can cut conversions by as much as 20%. That’s not a technical issue. That is a revenue problem.
In addition, Core Web Vitals are now officially used by Google as ranking signals. If your host is not able to provide fast, stable performance then you are essentially handing organic traffic over to your direct competition. It really is that direct.
The majority of business owners choose a hosting plan by price or some shiny homepage. But the better approach is to benchmark first, buy second. Benchmarks remove the guesswork. They give you actual numbers from actual conditions.
Additionally, benchmarks help you negotiate. If a host claims 99.9% uptime and they’re monitoring shows only 97%, then you have an escalation or switch grounds.
Metric #1: Time to First Byte (TTFB)
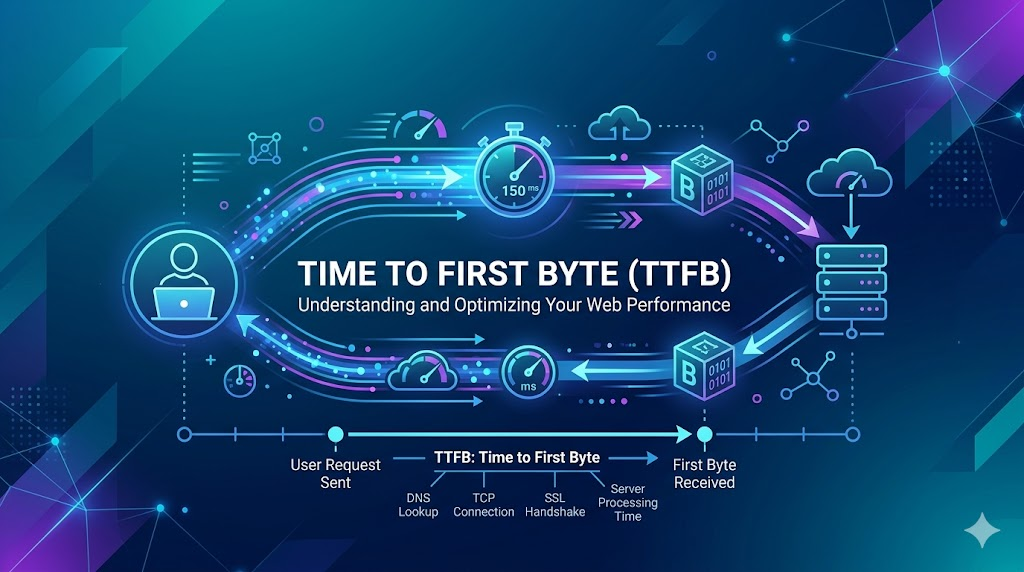
It is dramatized on the amount of time a browser has to wait until it receives that very first byte from your server, which means TTFB stands for time to first byte. Think of it as the “hand-shake” speed of your visitors and your WordPress hosting server.
The target to hit: 600ms is a major red flag.
Why should business care about this? Simple. When Google first crawls your site, TTFB is usually one of the very first things they measure. A slow Time to First Byte indicates a slower server that translates to lower crawl efficiency and consequently worse rankings.
TTFB also influences the speed at which your entire page loads. Everything else — pictures, scripts, fonts — lines up behind it. And so TTFB defines limits on everything else performance-related.
What Causes Poor TTFB?
- Shared overloaded hosting servers too many tenants
- No server-side caching in place
- Slow database queries, executing on each request from scratch
- Differences in geographical distance between the server and visitor
The solution typically involves improved hosting infrastructure, PHP opcode caching, and object caching. Managed WordPress hosts usually take care of all this for you by default.
| The first thing to check when a website is underperforming, is TTFB — not overall page load time. A sub par TTFB is almost always a server-side issue: potentially an overloaded host, unoptimized database or php configuration. You fix the TTFB, and then often everything downstream embraces it.” |
Metric #2: Core Web Vitals
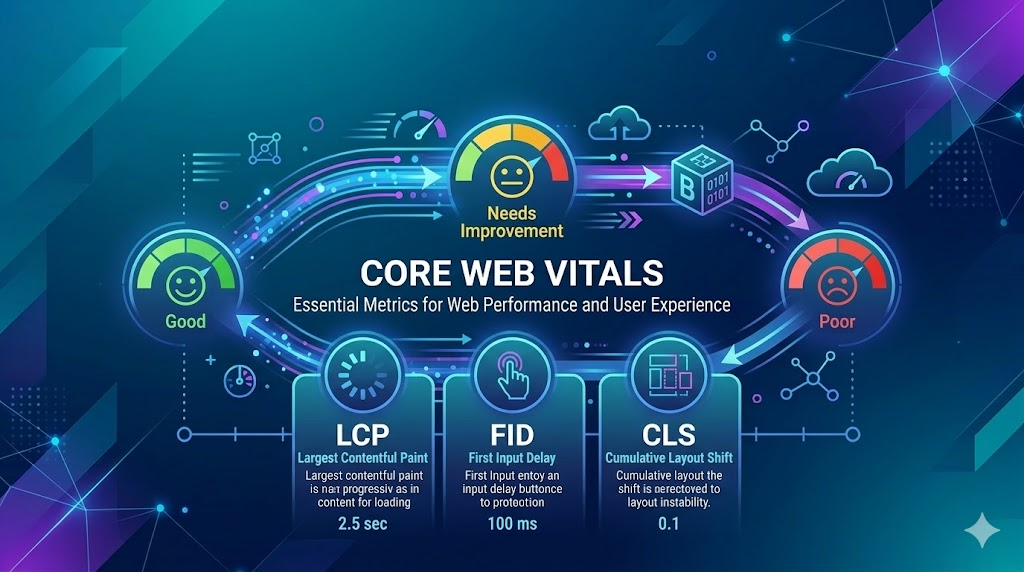
Core Web Vitals entered Google’s lexicon as official ranking factors and there is no going back. These three metrics better represent the actual experience of real users, not simple speed.
Largest Contentful Paint (LCP)
Target: under 2.5 seconds. LCP → Largest Contentful Paint is the time taken for the largest element on your page to load. Typically, a hero image or headline block.
From the business perspective, LCP is what your visitor really sees as “the page loaded. If you take 4 seconds, they have literally mentally left the conversation — and maybe even gone.
Cumulative Layout Shift (CLS)
Target: under 0.1. CLS measures visual stability. Ever clicked a button and hit the wrong thing because the page jumped? That is a CLS failure.
This is crucial for e-commerce WordPress websites. If your “Add to Cart” button moves before a visitor clicks, you might lose that sale. In turn, poor CLS also negatively impacts your Core Web Vitals score.
FID / INP (First Input Delay / Interaction to Next Paint)
Think of it this way. Even if your page loads quickly, but someone experiences lag while typing or clicking, they will leave disgruntled. There’s a dollar value associated with that frustration.
Metric #3: Uptime and Reliability

Every host advertises 99.9% uptime. But there is a vast difference between marketing claim and measured reality. Let us do the math quickly.
Uptime Reality Check
- 0.1% downtime = 8.7 hours of downtime per year
- 99.5% uptime = ~43.8 hours downtime per year
- 99.0% uptime = ~87.6 hours of downtime per year
For an online shop that generates $500/hour in revenue, going from 99% to 99.9% uptime creates savings of ~$40,000+ a year.”
So always request independently monitored uptime data. Don’t just believe anything your hosting providers claim. You can use external tools like UptimeRobot and Pingdom, which will do the zero contribution check for you.
Also, consider the nature of your downtime. Scheduled maintenance is different than unexpected crashes. An unpredictable host failure during peak hours is far worse than one that has planned maintenance windows.
Meter #4 Load Handling and Concurrent Users
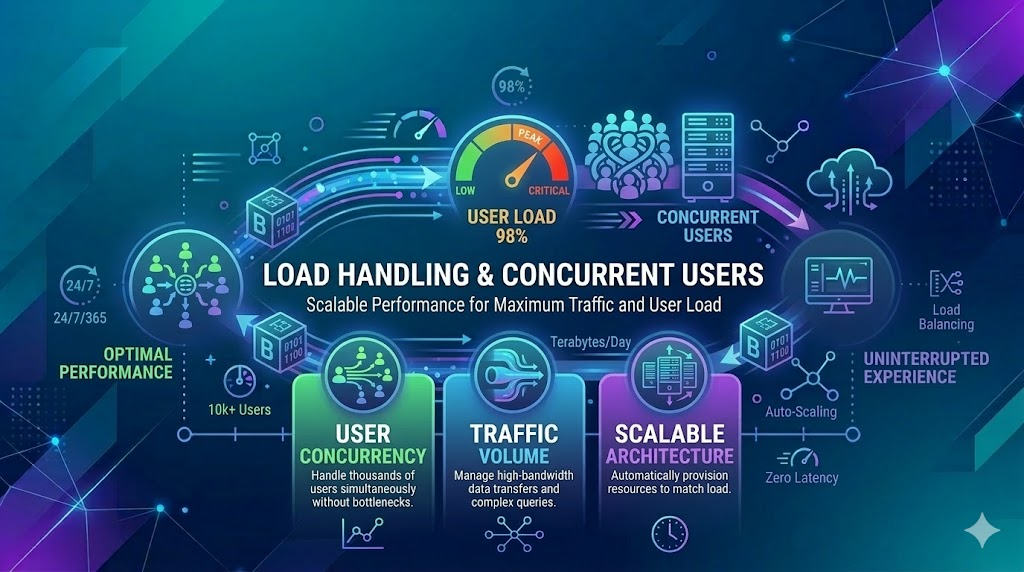
In short, single-user speed tests are completely meaningless for commercial business decisions. What you actually want to know is: how does the host handle 100, 500 or even 1,000 visitors hitting your site at once?
You know this as load testing, and it’s the measurement that almost everybody ignores. But it is the most business-critical test of all. Traffic spikes occur — following a viral post, product launch or sale event.
A host that does great in a single test but collapses under 200 users at once is a liability. Your biggest traffic moments are also your biggest crisis moments.
What to Look for in Load Testing Results
- Peak load — response times should be less than 500ms
- With regular traffic spikes, the error rate should be less than 1%.
- After a traffic burst, the server should recover gracefully — no remaining sluggish
As such, if you evaluate hosts, check for the published load test results. Alternatively, use tools like Loader.io or k6 to help you run your own tests on a trial account before signing on the dotted line.
Metric #5: Security Performance

Performance and security are not distinct — security is part of performance. The website via WordPress lost all of its traffic in a minute.
So when it comes to benchmarking hosts, take these security metrics as seriously as you would speed numbers.
Key Security Benchmarks to Evaluate
In brief, a host with weak security infrastructure is counter in your business. The cost of a breach — lost data, customer trust, SEO rankings — is almost always greater than the cost of better hosting.
- Real-time malware scanning and removal.
- Web Application Firewall (WAF) benefit server to block malicious traffic and attacking.
- DDoS Protection that stop traffic floods crashing websites.
- Security Updates that automatically applies critical patches in a timely manner.
- Backup in an automated fashion with rapid restore options
Metric #6: Database Performance

WordPress is fundamentally database-driven. Multiple database queries are usually run for every page load. Slow database performance is one of the most prevalent and least diagnosed causes of slow WordPress sites.
If benchmarking look for mysql or mariaDB optimization and query caching. The difference in response times between an optimized database setup and an unoptimized one can be 2x to 5x.
Moreover, hosts that run the latest PHP versions provide you a free performance improvement. WordPress workloads run significantly faster with PHP 8.2+ than PHP 7.4. That is a warning light straight off if a host shoves you on an outdated PHP version.
Metric #7: Integration with CDNs and Global Reach

If your audience is not purely local, server location alone doesn’t cut it. A content delivery network (CDN) will cache your static assets, images, CSS, JavaScript, in edge locations around the world.
The business case is straightforward. A person in London hitting a server in New York with no CDN would experience 300-500ms of network latency at least. That same visitor cross a CDN edge node in Frankfurt would see 20-50ms, and that difference is perceptible.
Moreover, CDN integration removes the burden from your origin server. Which allows better performance during traffic spikes, without needing to jump a tier on your hosting plan. This is one of the highest-ROI performance improvements you can do.
To assess WordPress hosts with CDN, find out if integration is automatic (or if you have to handle it), the number of edge locations they provide, and whether you can adjust cache rules without relying on a developer.
Start with Shared vs. Managed WordPress Hosting Benchmarks
This is the point at which a lot of business owners make an expensive mistake. They go for cheap shared hosting, and end up paying a lot more money later on to deal with slow performance, security problems, etc.
Across almost every metric, managed WordPress hosting has consistently scored better than generic shared hosting in benchmarks. Here is why:
| Feature | Shared Hosting | Managed Hosting |
| TTFB | 400–800 ms avg | 80–200 ms avg |
| Uptime | Typical 99.0–99.5% | Guaranteed 99.9%+ |
| Security | Basic | Hardened WordPress security |
| Support | General tech support | WordPress experts |
| Caching | Manual configuration | Built-in server-level caching |
| PHP Version | Limited options | Current versions supported |
The business reasoning is simple. Managed WordPress hosting is designed specifically for WordPress. They optimize everything from the server stack to the support team for your platform. You pay more up front but spend less time fixing things.
Moreover, faster sites convert better. The revenue impact and justification of cost difference can come in weeks if managed hosting gets your load time improved by even one second.
How to Actually Run a WordPress Hosting Benchmark
Knowing the metrics is half the battle. Here’s how to implement benchmarking before you commit to a specific hosting plan.
- Use Pingdom Tools to test TTFB from various geographical locations
- Run a load test with Loader. io to simulate concurrent traffic. Add 50 users, get up to 250.
- UptimeRobot independent link (monitor uptime over 30+ days)
- Open up a request to the support service and time how long it takes for you to get a response. This is a benchmark too.
Finally, document everything. Same tests at the same time of day from the same location, characteristically compare host A to host B — consistency is what makes comparison meaningful.
I’ve witnessed businesses overnight lose six months of SEO work from being restricted by Google because their host doesn’t have adequate malware scanning implemented. Security is not a nice-to-have. This is a key performance indicator. I also weight security metrics when I evaluate hosts, nearly as heavily as speed. None of these things make your business any less dead, though.

Start With Secure Hosting
With Ultahost, get transparent data management, advanced encryption, and reliable hosting environments built for modern regulatory standards.
Conclusion
In the end, selecting an appropriate WordPress hosting environment would be reduced to the knowledge of benchmarks that actually have a real influence on performance, reliability, and security.
The values of TTFB, uptime, the speed of page load, and server response time are directly related to the way people perceive your site. Even slight delays can influence the engagement, conversions and the search position, and as such, it is important to monitor such indicators as a serious WordPress site owner.
Instead of paying attention only to the price or storage capacity, companies must consider hosting partners in terms of actual performance metrics and the quality of the infrastructure.A host that prioritizes performance metrics, quality repeatable builds and responsive security will ultimately provide a couple of just grounds to grow a WordPress site on.
FAQs
What is the benchmark of the most important WordPress hosting?
One of the most important metrics is TTFB (Time to First Byte): it is a metric that measures a speed at which a server starts responding to a request.
What is the good TTFB of WordPress hosting?
The average TTFB of 200 ms or less is regarded as superior on optimally performance WordPress hosting.
What is the impact of uptime with a WordPress site?
Increased uptime means that your site will be available to visitors. The majority of the reliable hosting companies offer 99.9 uptime or more.
What is the value of caching in WordPress hosting?
Caching creates server load reductions and accelerates the delivery of pages by storing highly accessed pages.
Would it be better to use managed WordPress hosting with better benchmarks?
Managed WordPress hosting can deliver higher performance since the servers are configured to work in WordPress specifically.


