
How to Fix Update and Upgrade Issues in Kali ...
Kali Linux is a powerful and versatile operating system...


Analyzing server logs is one of the best ways to see how a system behaves under real world conditions. Logs document every request, response, and error, and they are one of the best sources of information we have for discovering performance bottlenecks, detecting failed transactions, or identifying anomalous activity that is detrimental to system performance.
To interact with these large files, administrators want to use something that is fast, reliable, and easy to get started with that doesn’t require a lot of setup. The awk command is just the thing. Awk will let us quickly filter, scan, and extract useful patterns from logs so that we can follow logs without needing to install complex software or use a third party tool.
This article will focus exclusively on using awk for investigation of server performance issues. You’ll learn step-by-step how to detect errors, measure response time, analyze traffic, and ultimately spot trends that are often buried inside server logs.
Server logs are records that detail requests, responses, and events, created by a system or application. Types of logs include web server logs (related to client requests), application logs (related to applications), error logs (related to failures), and access logs (to track user activity and traffic sources). Logs contain the raw information showing what is happening in the system in real time.
Unlock Server Insights with awk!
Master log analysis using powerful yet simple awk commands. Optimize performance, troubleshoot faster, and keep your Linux VPS running at peak efficiency.
Logs are important for maintaining web server performance. Using the logs to observe things like high response to requests, consistent crashes, or long request times. Logs document a time stamp of everything happening, including system calls from the server and all requests coming in from clients. Logs will allow teams to notice unusual patterns and take action before the unusual pattern becomes a major issue.
Logs can be used effectively to conduct system diagnostics and root cause analysis, which leads to quicker remediation of problems in web applications. Even further, there would be no way to track down the exact source of downtimes, latencies, or configuration problems associated with issues if there were no logs.
High response times are among the most obvious issues visible in server logs. Slow requests indicate there are delays in processing requests that are directly tied to the user experience. Monitoring response times through logs can help to identify queries, endpoints, or processes that are taking longer than expected.
Another frequently encountered issue is seeing frequent HTTP status codes such as 500, 404, or 503. Status codes signal failed transactions, missing resources, or temporary disruptions. Ongoing tracking of these errors allows the administrator to identify repeat-failures and address issues before they become problematic.
Logs provide real insight into what is actually happening to the resource, including bottlenecks being caused from spikes in CPU usage, memory, or disk I/O levels that may be entirely consumed. It’s important to notice these indicators in a proactive way to reduce possible downtime and user impact.
The awk command uses this basic structure:
awk 'pattern { action }' filename
Here, the pattern tells awk what to search for, and the action tells it what to do when it finds a match. This makes awk ideal for filtering and extracting data from text files.
Let’s assume we have a file named sample.log with the following content:
192.168.1.1 - - [25/Sep/2025:10:00:01] "GET /index.html HTTP/1.1" 200
192.168.1.2 - - [25/Sep/2025:10:00:05] "POST /login HTTP/1.1" 500
192.168.1.1 - - [25/Sep/2025:10:00:10] "GET /about.html HTTP/1.1" 200
192.168.1.3 - - [25/Sep/2025:10:00:15] "GET /contact.html HTTP/1.1" 404
192.168.1.2 - - [25/Sep/2025:10:00:20] "GET /index.html HTTP/1.1" 200
To print every line in this file:
awk '{print $0}' sample.log
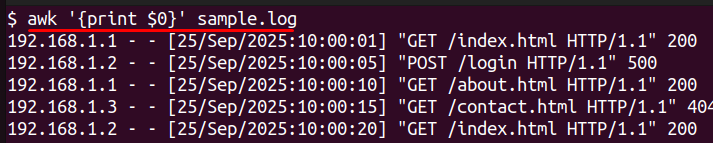
This command processes each line in the sample.log and outputs it back, unchanged.
To only return the first column with the IP addresses from the file:
awk '{print $1}' sample.log
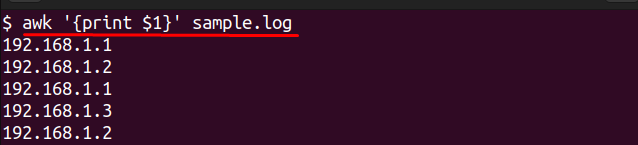
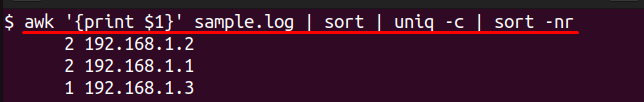
This returns a list of all IP addresses in the log, to provide an easily reviewable list. If you want to count how many times a unique IP address appeared in the file:
awk '{print $1}' sample.log | sort | uniq -c | sort -nr
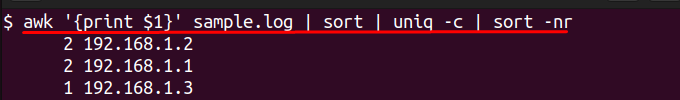
This will return a list of IP addresses in the log sorted by number of times seen, which is helpful for identifying the clients that made the most requests to your system.
These examples provided in awk illustrate the basic capability of using awk for analyzing log data and logging data, to also provide simple readable data even if you do not have any special tools at your disposal.
Here is one way we are going to analyze the logs for performance problems using awk. We will base our examples on a log file named sample.log.
To find requests with response times greater than 100 milliseconds:
awk '$8 > 100 {print $0}' sample.log
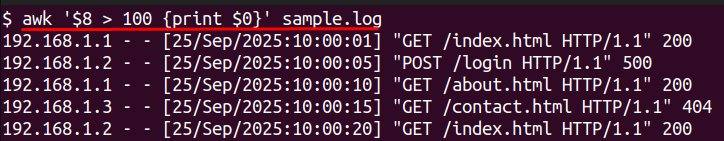
This will read the 8th column of the log and only return entries greater than 100 milliseconds, which is a good way of using logs to evaluate response times for your request.
To tally the occurrences of each HTTP status code:
awk '{print $7}' sample.log | sort | uniq -c | sort -nr

This example will process the seventh column of data – which contains your status codes. It will organize the data into groups, count the number of occurrences per status code, then it will numerate the counted lines. This is helpful to keep track of status codes, especially error code responses.
To summarize, identify the most frequent IP addresses:
awk '{print $1}' sample.log | sort | uniq -c | sort -nr
This example will return a list of the IP addresses, sorted by the frequency of requests from the identified IP address. This is useful for isolating an IP address with an inordinate load.
To summarize hourly, aggregate traffic peaks by minutes:
awk -F'[][]' '{print $2}' sample.log | cut -d: -f1,2 | sort | uniq -c | sort -nr

In this case, it will reduce time stamps down to only hours and minutes and count the time stamps requested. It will sort the sorted lines. You will quickly see hourly pattern trends showing times of peak traffic.
To calculate average response time for all requests:
awk '{sum += $8} END {print "Average Response Time:", sum/NR}' sample.log

This example sums all the numbers in the eighth column (the approximate time), then divides by total number of lines. This may be helpful when trying to identify some point of congestion on your webpage.
These are examples of how awk will take your raw log data and transform it into a representation of meaningful information you can use to apply to server load, performance monitoring, and troubleshooting your site.
Awk is capable of many advanced operations beyond filtering typical patterns and logs, it begins to open the door to much deeper involvement with understanding request logs for deeper log analysis.
You can also match patterns instead of fixed column positions. For example, if you want to find all lines with “GET”:
awk '/GET/ {print $0}' sample.log
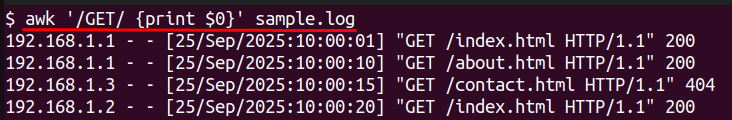
This allows you to search the file specifically for “GET” requests which is useful in log analysis over specific patterns.
To sum the value of a column, awk can aggregate data based on your request. For example, in the case of determining total response time:
awk '{total += $8} END {print "Total Response Time:", total}' sample.log

This will sum all of the observable response times and return the total sum.
Count how many requests coincided with a 500 error:
awk '$7 == 500 {count++} END {print "500 Errors:", count}' sample.log

This allows you to log, or isolate, problems that may have occurred rapidly.
Awk interacts well with utilities like grep, sort, and uniq. For instance, counting distinct URLs that have been accessed:
awk '{print $7}' sample.log | sort | uniq

This gives a quick snapshot of all the distinct endpoints and is useful for quickly analyzing root cause.
In this article, we covered its use with rapid server log analysis in order to surface and troubleshoot performance issues. We began with learning what server logs are and how it is useful to use after an event as a system diagnostic or for root cause. Next we learned how to get started with awk including the syntax and the simple commands for reading, or parsing, logs. Then we read through a step by step process of diagnosing, finding, and counting high response times, counting error codes, isolating high traffic, deep diving into the peak traffic times, and calculating the average response time.
By being able to implement these awk tools and/or techniques, you can interpret raw log data into useful information and insights for troubleshooting without heavy and complex tools. Awk can be a very effective server and log data utility that can bring down server performance and protocol logging to afford your users the most effective experience.
Looking to take your Linux VPS management skills to the next level? Ultahost’s Ubuntu VPS hosting gives you the perfect balance of speed, reliability, and security. Whether you’re analyzing server logs, optimizing performance, or running critical applications, these VPS solutions are designed to deliver consistent results and simplified control.
UltaAI – Smart AI Assistant for Ultahost Clients
UltaAI is your advisor for anything related to domain or hosting. Experience personalised suggestions.