How to Install PrestaShop on Windows
Installing PrestaShop Windows setup is a straightforwar...
MTR (My Traceroute) is a powerful network diagnostic tool that combines the functions of traceroute and ping into a single application. It is widely used to identify and analyze network issues such as latency and packet loss by providing real-time, detailed reports of the route packets take to their destination. This makes it a valuable tool for network administrators and IT professionals who need quick and reliable insights into connectivity problems.
Although MTR is traditionally associated with Unix-based systems, it is also available for Windows users. Install MTR on Windows can help diagnose network performance issues and monitor connections effectively. Generate detailed reports, enabling users to pinpoint problematic hops in the network path and take corrective actions.
This guide will explore the steps to install, configure, and generate MTR reports on Windows, making it easier to troubleshoot and optimize your network connections.
MTR is typically used on Unix-based systems, but Windows users can utilize it through third-party tools or ports like WinMTR. Below is a step-by-step guide to set it up:
Install MTR on Our Cheap Windows VPS!
With Ultahost, Hosting Windows VPS has never been easier or faster. Enjoy ultra-fast SSD NVME speeds with no dropouts and slowdowns.
Visit the official WinMTR website to download the tool. Choose the version that matches your system architecture (32-bit or 64-bit):
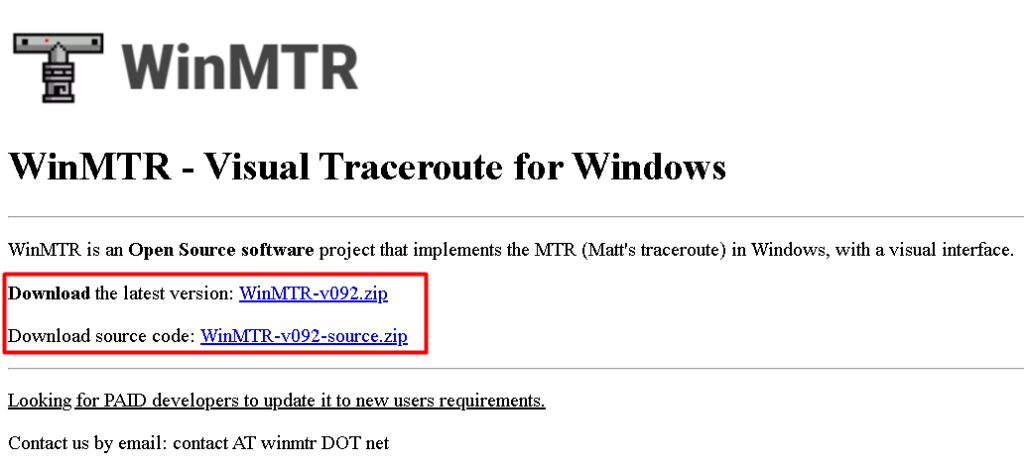
Once downloaded, extract the WinMTR archive to a desired folder on your computer. Most distributions are in ZIP format, so ensure you have extraction software like WinRAR or 7-Zip software installed:
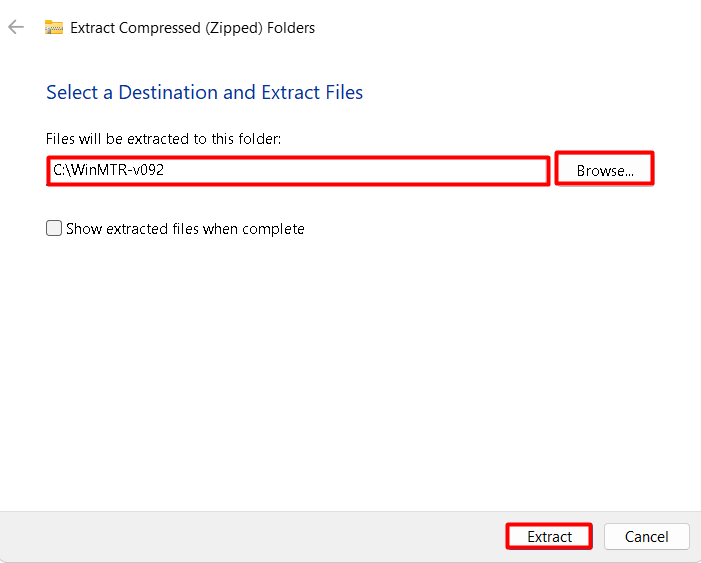
Navigate to the extracted folder and locate the executable file (e.g., `WinMTR.exe`). Double-click the file to launch the tool. No installation is required, as WinMTR is portable and runs directly from the executable:
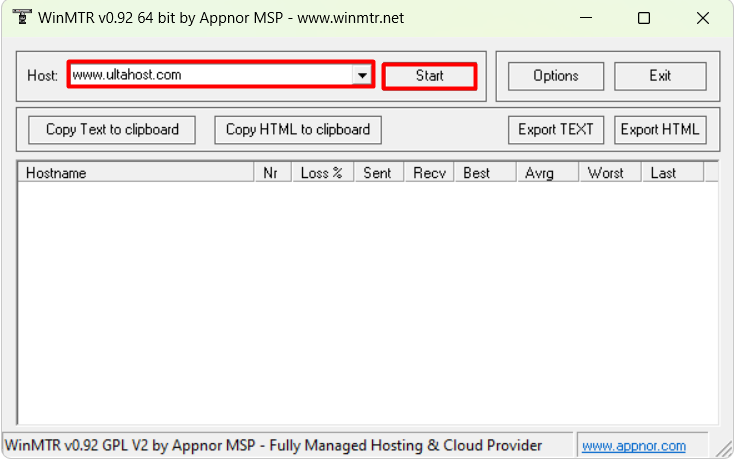
After installing MTR and launching it, input the target hostname or IP address you want to analyze. For example, you can enter a website URL or the IP address of a server. After that, click the Start button to initiate the network diagnostics.
WinMTR will display real-time statistics, showing the route packets take and their performance at each hop:
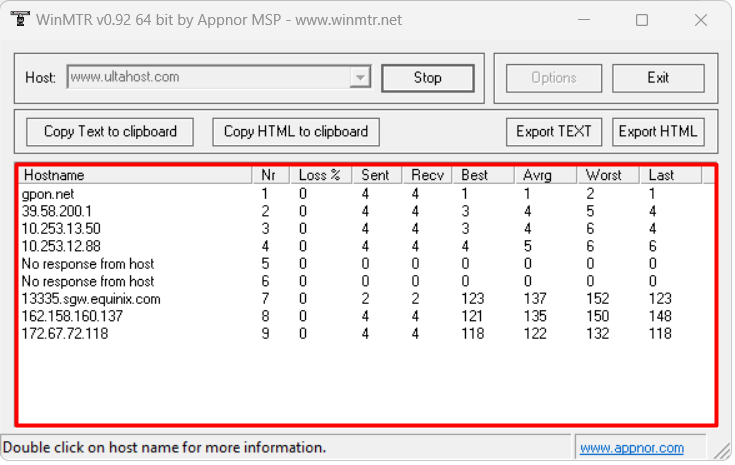
After completing the test, you can save the report for future reference or share it with your network administrator or ISP to resolve issues:
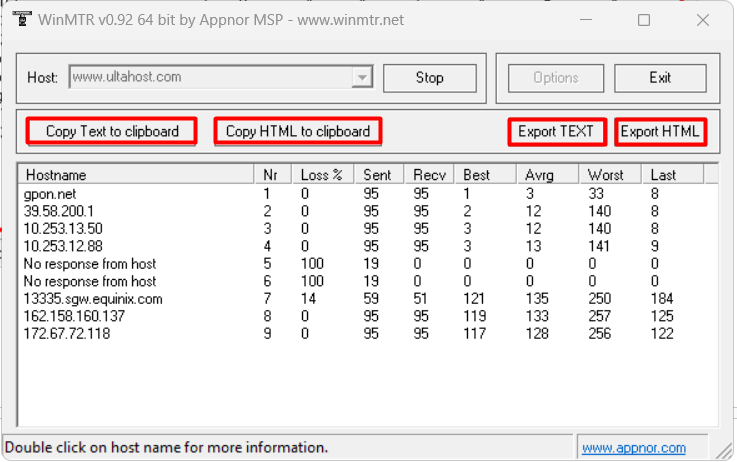
Learn also How to Generate Report Using MTR on Linux.
MTR is an essential tool for diagnosing and troubleshooting network issues. It combines the capabilities of traceroute and ping, providing detailed, continuous feedback on the state of network paths. Its versatility and accuracy make it a popular choice for IT professionals and network administrators. Below are the key reasons why MTR is a must-have tool, discussed under separate subheadings for clarity.
MTR continuously monitors the path of data packets, offering real-time updates. Unlike traditional traceroute, which provides a one-time snapshot, MTR’s dynamic output allows users to detect fluctuations in network performance, such as intermittent slowdowns or route changes. This makes it particularly useful for monitoring unstable connections.
MTR highlights packet loss and latency at every hop in the network. By pinpointing the exact locations of these issues, it eliminates guesswork, saving time in troubleshooting. This level of precision is critical for resolving connectivity issues that impact performance.
MTR generates detailed reports containing key metrics, such as average latency, packet loss percentage, and hop details. These reports can be saved or shared with others, making them ideal for collaboration or communicating with service providers to resolve issues faster.
In addition to troubleshooting, MTR can be used proactively to monitor network health. IT teams can run it periodically to identify potential bottlenecks or vulnerabilities before they escalate into significant problems.
Although originally developed for Unix systems, MTR’s compatibility with Windows has expanded its user base. Its availability across platforms ensures that users can rely on its features regardless of their operating system.
MTR is equipped with several powerful features that make it an essential tool for analyzing network performance. Unlike typical diagnostic tools, its design emphasizes functionality, adaptability, and precision.
MTR integrates traceroute and ping into a single tool, streamlining network diagnostics by simultaneously displaying route paths and latency data for each hop.
MTR continuously refreshes its output, ensuring users see up-to-the-second changes in network performance. This feature is particularly useful for identifying transient issues.
The tool’s interface dynamically updates, allowing users to monitor individual hops in real-time. On some platforms, it even offers interactive options for drilling deeper into specific metrics.
MTR provides detailed statistics for each hop, such as latency averages, best and worst round-trip times, and standard deviation, offering a nuanced view of network behavior.
MTR is lightweight, with minimal system requirements, making it suitable for environments with limited resources.
Users can configure packet size, test intervals, and other parameters, tailoring MTR to specific diagnostic needs.
Generating a network diagnostic report using MTR is a straightforward yet effective process that provides invaluable insights into connectivity issues. By inputting a target hostname or IP address and starting the analysis, MTR collects real-time data about packet routes, latency, and packet loss. This allows users to observe network behavior at every hop and identify potential problem areas. The ability to save and share reports further enhances usability to run mtr on windows, making it an indispensable tool for resolving network issues quickly and efficiently.
With the easy installation of tools like WinMTR on Windows, you can utilize the capabilities of MTR without switching operating systems. Its real-time updates, comprehensive statistics, and user-friendly interface simplify the troubleshooting process for both professionals and non-technical users.
If you are generating reports for testing purposes that require high resources consider Ultahost’s fully managed dedicated server plans. Our hosting offers the flexibility and control of a dedicated server which means you can easily fulfill your requirements and configure your server settings to optimize performance for your workloads.
MTR is a network diagnostic tool used to identify issues like latency and packet loss by analyzing the path and performance of data packets.
Yes, MTR can be used on Windows through third-party tools like WinMTR, which offers similar functionality in a user-friendly format.
Launch MTR, input the target hostname or IP address, and start the analysis. Once the diagnostics complete, you can save the report for further use.
An MTR report includes details about latency, packet loss, and the performance of each network hop along the packet’s route.
Yes, MTR provides real-time updates, continuously refreshing its data to display live changes in network performance.
No, tools like WinMTR are portable and run directly from an executable file without installation.
Yes, MTR pinpoints problematic network hops, making it easier to troubleshoot and resolve issues with your ISP or network administrator.