
How to Install Fedora on VirtualBox
The installation of Fedora using VirtualBox is a great ...


When working on Linux, keeping track of system performance is an important task. For this, one of the most useful tools is the htop command. Unlike the traditional top command, htop gives a more user-friendly and interactive view of what’s happening inside your system.
With htop, you can easily check running processes, system resources, server monitoring, CPU load, memory usage, and swap space in real time. It highlights information with colors, supports mouse navigation, and even lets you scroll both vertically and horizontally to view complete details. This makes it much easier to spot performance issues or manage processes compared to older tools.
In this article, we’ll explore how to use the Linux htop command effectively, covering its main features and practical usage.
To use the htop command in Linux, simply type the following command in your terminal and hit the ENTER key:
htop
As a result, an interactive dashboard will be opened, where you can view all active processes along with CPU, memory, and Linux swap usage. You can also include different options when starting htop to adjust what information is displayed.
Explore Our Linux VPS Hosting Today!
Get the speed and control of a VPS at an affordable price. Start your hosting journey now and see why we’re a top choice for developers and businesses alike.
When using the htop command in Linux, you can add different options to customize the output. Some of the most popular ones are listed in the following table:
The htop command helps us monitor and manage a Linux server in real time. It provides a dynamic, interactive view of all running processes, CPU and memory usage, and swap space, making it easy to spot resource-intensive tasks.
Let’s go through the following examples to see how this command helps us monitor and manage advanced servers.
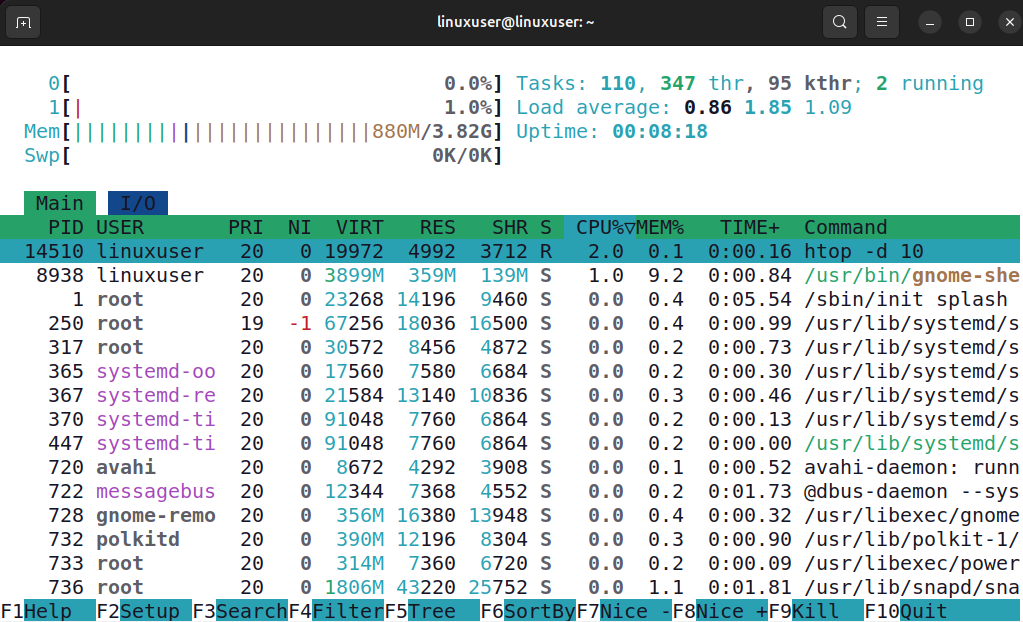
The -d option in htop allows you to control how often the display refreshes. For instance, running the following command sets the update interval to 1.0 seconds.
htop -d 10
When I ran the htop command on my Linux system, I immediately got a clear, real-time view of how my system was performing. At the top, I could see the CPU usage for each core, CPU 0 was almost idle at 0.0%, while CPU 1 was barely active at 1.0%. Memory usage showed 880MB of my 3.82GB RAM in use, and swap wasn’t being used at all.
The system had 110 tasks running across 347 threads, with just 2 actively running, and the load average over 1, 5, and 15 minutes was comfortably below 2, indicating the system was lightly loaded.
Similarly, you can specify any value to set the delay according to your needs. For example, use 16, 20, etc. to set the delay of 1.6, 2.0 seconds, and so on.
Adjusting this delay is useful because it reduces the frequency of screen updates, making it easier to observe system activity without constantly changing numbers. This can be especially helpful when monitoring a busy system, as it gives you a clearer view of resource usage over time.
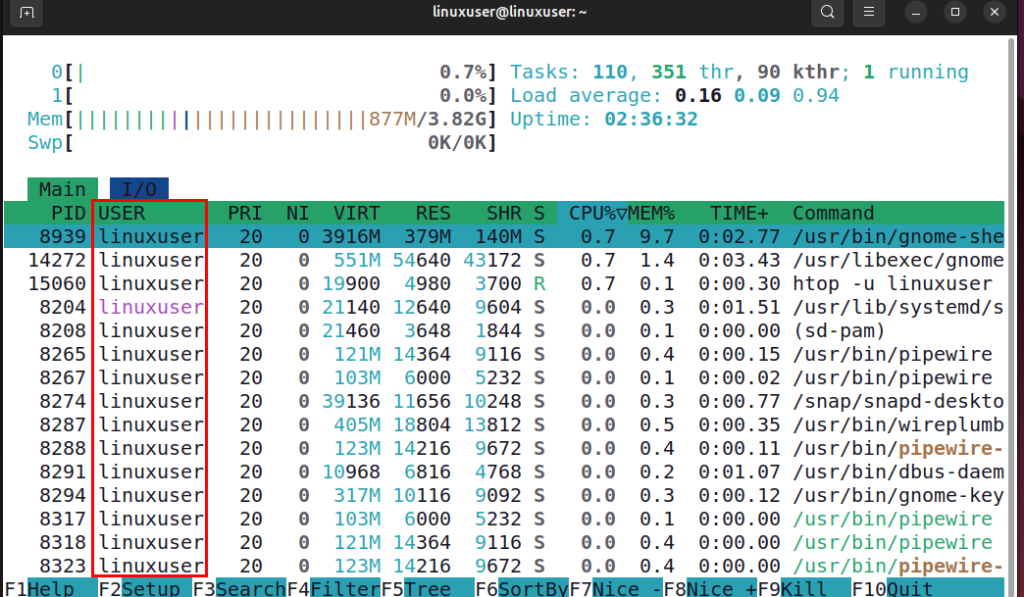
You can use the htop command with the -u option to view only the processes running under a specific user. This is useful when you want to monitor or manage the tasks of one particular user without getting distracted by other system processes. For example, to see processes for a user named linuxuser, you can run the following command:
htop -u linuxuser
The htop command filters the output and shows only the processes belonging to linuxuser, making it easier to focus on that user’s activity.
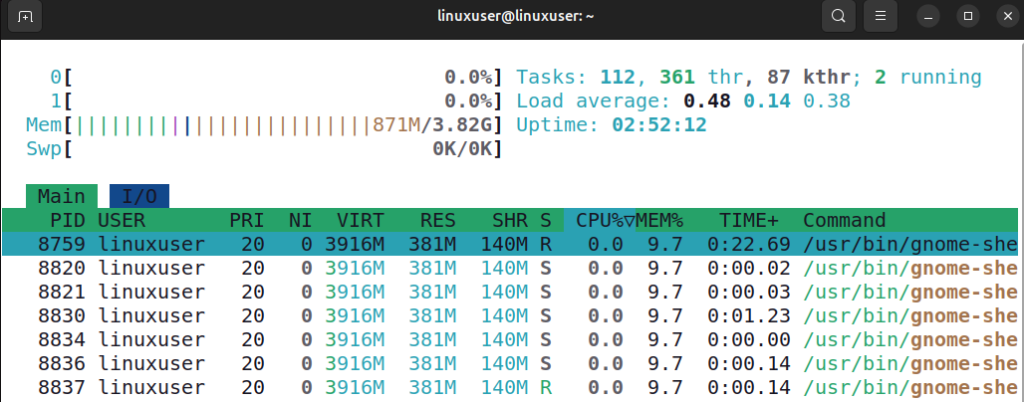
The htop -p <pid> command allows you to focus on a specific process by its Process ID (PID). When you use this command, it shows the PID you specify along with all child processes or threads created by that process. This gives a complete view of the process’s activity. For example, to monitor a process with PID 8759, you would run:
htop -p 8759
This helps you track the CPU, memory, and overall resource usage of the main process along with any related subprocesses, making it easier to understand how the process operates.
Read also Exploring the Linux tr Command
The htop -s <column> command allows you to organize the process list based on a specific column, such as CPU usage, memory usage, or process ID. This makes it easier to find the processes that are using the most resources or to track processes in a particular order. For example, if you want to sort processes by memory usage, you can specify the memory column:
htop -s PID
The output shows that htop has sorted the processes based on their PID.
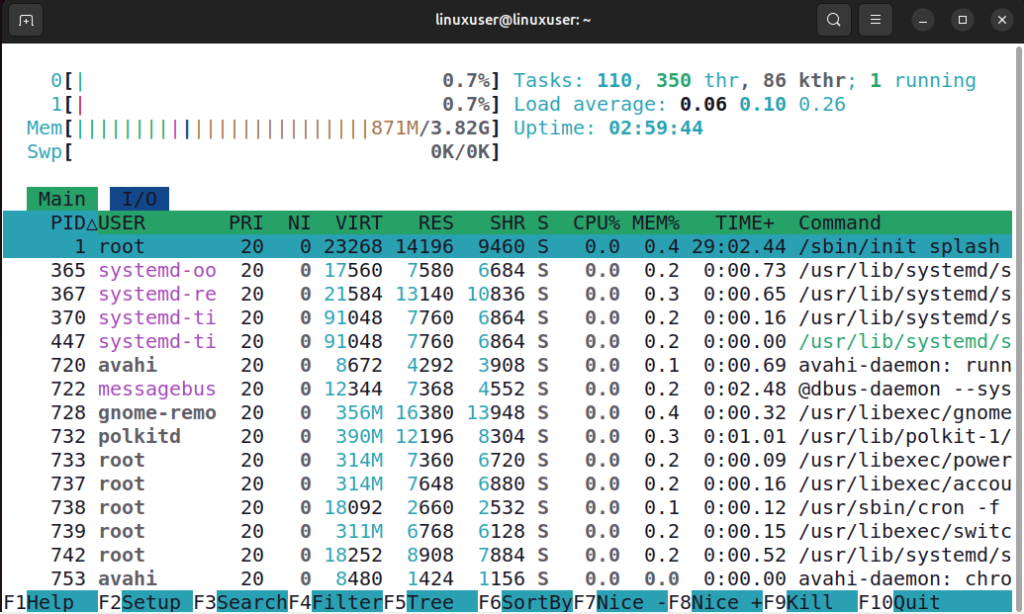
This makes it easier to view processes in numerical order and quickly locate a specific PID among all running processes. Similarly, you can sort the output with respect to any other column of your choice.
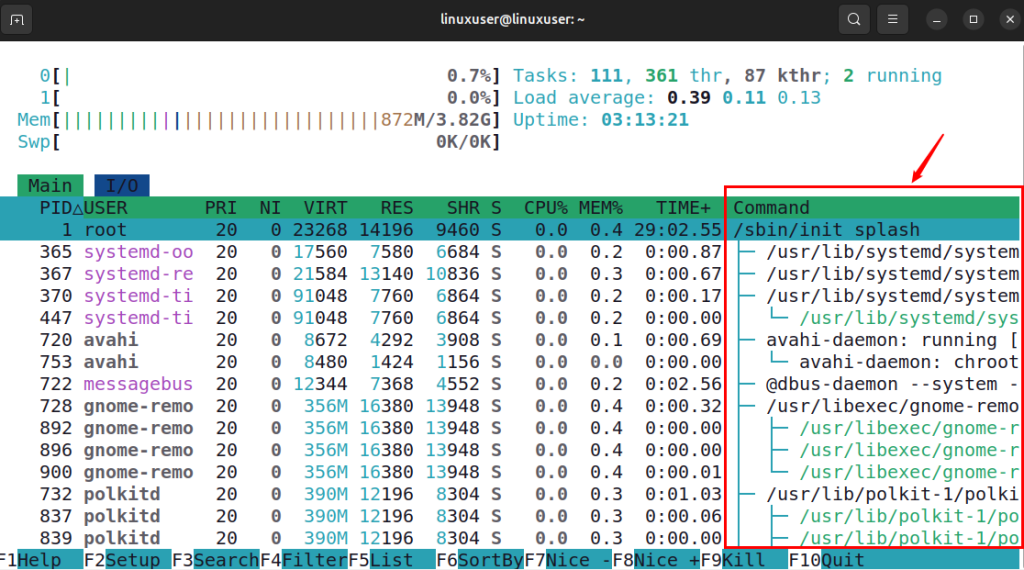
You can use the htop command with the -t option to show all running processes in a tree view under the Commands column. This layout makes it easy to see the parent and child relationships between processes, helping you understand which processes are spawned by others and how they are connected.
htop -t
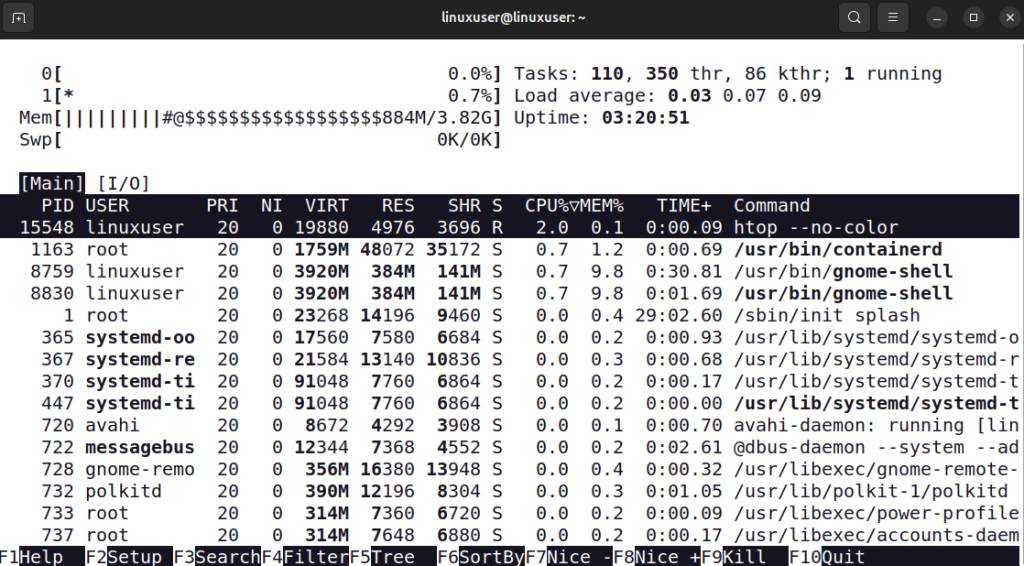
The htop --no-color command launches htop without using any colors in the interface. This can be useful if you are working in a terminal that does not support colors or if you prefer a plain, monochrome view for easier reading or capturing output in logs.
htop --no-color
When using htop, you can interact with your system’s processes using several keys and shortcuts:
These commands allow you to efficiently monitor and manage system processes while maintaining full control over resources.
The htop command is a useful tool that helps us monitor and manage Linux systems in real time. It offers a clear view of running processes, CPU and memory usage, swap space, and system load, making it easier to identify resource-intensive tasks. With its options, you can customize the display to focus on specific users, individual processes, or particular columns, view processes in a hierarchical tree structure, adjust refresh intervals, or even run it without colors.
Looking to take your Linux experience to the next level? Ultahost’s Ubuntu VPS hosting gives you the perfect balance of speed, reliability, and flexibility. Whether you’re running applications, managing websites, or handling development projects, our VPS solutions are designed to deliver smooth performance and hassle-free management.
htop is an interactive system-monitoring tool that provides real-time information about running processes, CPU and memory usage, swap space, and system load, with a user-friendly interface.
Unlike top, htop offers a colorful, interactive interface with mouse support, vertical and horizontal scrolling, and easier process management.
You can use the htop -u <username> command to display only the processes belonging to a particular user.
You can sort processes using the htop -s <column> command, where <column> can be CPU usage, memory usage, PID, or other available columns.
The -d <delay> option allows you to set how often the display refreshes, helping you observe system activity at your preferred speed.
Yes. htop provides a dynamic and interactive view of system resources, helping you quickly identify resource-heavy processes and manage server performance efficiently.
Yes, htop supports various options to filter, sort, and organize processes, making it flexible for different monitoring needs.
Experience Ultahost’s Web Hosting!
Start your project with an affordable hosting plan that includes cPanel, free support, unlimited bandwidth, and simple setup. It’s perfect for beginners.

The installation of Fedora using VirtualBox is a great ...
If you are a Linux user, few tools commands is as perfo...
The chsh command a utility commonly found in Linux dist...
Rsync, which stands for "remote sync," is a powerful an...
Automation is one of the greatest advantages of using t...
A static IP address is required for server use, develop...