
How to Use the which Command in Linux
The which command in Linux is a simple yet powerful uti...


The Load Average which is also known as system load is a metric that indicates the average number of processes that were runnable or waiting to be run on system CPU over the last couple of minutes. This information helps you represent the overall system workload and identify potential performance. The load average is an important metric in Linux that reflects the average system load over specific time intervals.
In this post, we will discuss the Linux load average system and how to check the load average in the operating system by exploring the concept of load average indication of system health.
The load average represents the average number of processes in two states:
Therefore to understand load average Linux of 1 on a single-core system indicates that there is on average one process demanding CPU resources either actively running or waiting to be executed.
The uptime command typically displays the load average for three time periods:
These values offer insights into recent system activity trends and potential workload fluctuations.
There’s no single definitive interpretation of the ideal load average as it depends on several factors:
Check the Load Average on Linux today!
Ultahost provides Linux hosting with NVME SSD storage. You can practice the command in our Linux VPS and understand the monitoring process of the system.
There are several tools to check load average Linux. Here are some essential tools of the most common ones:
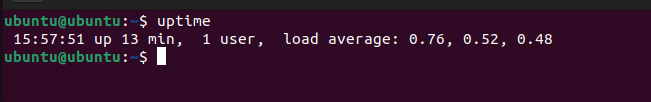
The Linux uptime command is a simple and quick way to view the load average. Open a terminal window and type:
uptime
The output will display the uptime system running time since the last boot the number of logged-in users and the load average for the past 1, 5, and 15 minutes.
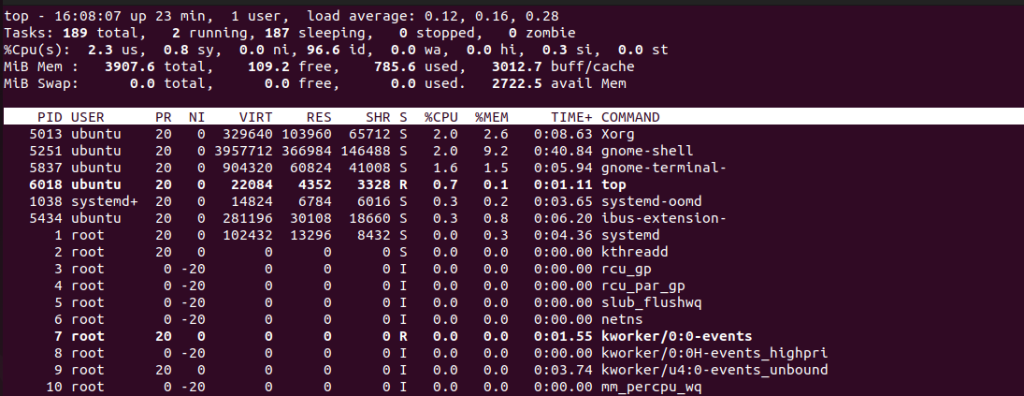
The Linux top command is primarily used to monitor load average Linux running processes and CPU usage but it also displays the load average in the top right corner of its output. Open a terminal window and type the following command:
top
While uptime provides basic information, the htop Linux command offers a more comprehensive interface for monitoring system resources, including the load average. Run the following command in the terminal:
htop
The interface displays various system metrics including CPU usage memory utilization and the load average displayed at the top right corner.
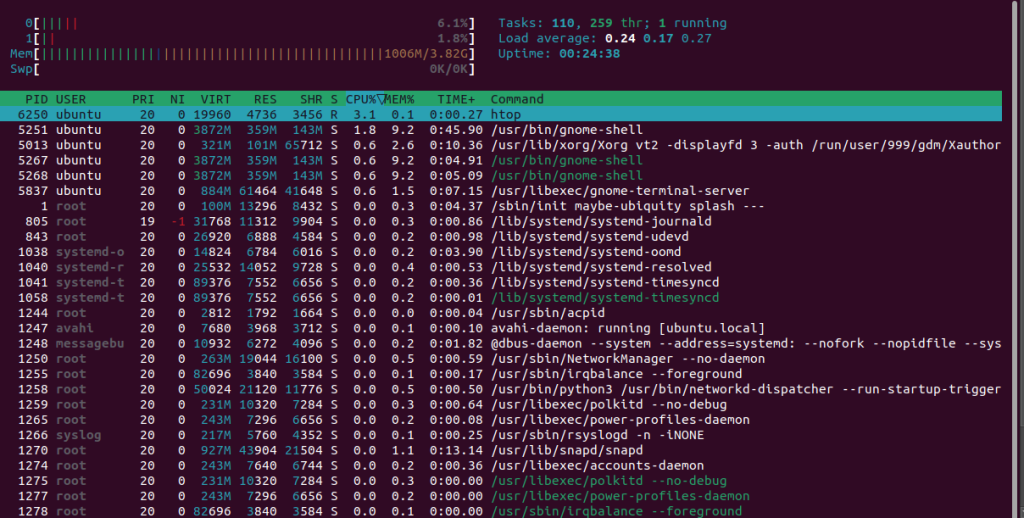
For the record, the difference between top and htop commands is the interactive user-friendly interface with color coding for CPU and memory limit usage through a scrollable process list with mouse and keyboard support.
Learn about How to Test Disk Speed Using the Linux Command Line.
This command directly reads the load average values from the /proc/loadavg file in the virtual file system.
cat /proc/loadavg

The glances utility is a more comprehensive system monitoring tool that provides an overview of various system resources, including CPU, memory, disk, network, and processes. It also displays the load average. You might need to install Glances first using the Linux distributions package manager.
sudo apt install glances
Once installed run the following command:
glances
The following are the important guidelines for load average in the Linux operating system:
Understanding and monitoring the load average is essential for maintaining a healthy and performant Linux system. By utilizing the above commands you can gain valuable insights into system activity and identify potential performance. Remember interpreting the load average effectively requires considering the specific system configuration and usage patterns.
If you found this guide useful and want to explore monitoring the process of load average in the Linux operating system to amplify command-line efficiency. But even the most streamlined can be slowed by hardware. That is where Ultahost’s fast and quick VPS comes in, which empowers the full speed of your process with lightning-fast data access.
Load Average is a measure of system workload. It shows the average number of processes waiting for resources.
Use the ‘uptime’ or ‘top’ command in the terminal. Load Average values represent system activity over different time intervals.
A Load Average close to the number of CPU cores is generally normal. Values higher than that may indicate potential performance issues.
Yes, a high Load Average can signify resource contention. Monitoring and optimizing system resources help maintain optimal performance.