
How to Change RDP Screen Resolution
Remote Desktop Protocol (RDP) allows you to connect to ...


A server does not scream when it struggles. It whispers. A spike in load average. A creeping rise in RAM usage. A slow response that users blame on the internet. You learn to read these whispers before they become problems if you manage infrastructure. This is where Linux server monitoring becomes your most valuable tool.
Most outages are slow suffocations. CPU usage climbs. Memory fills up. Swap starts working overtime as a result. Your system performance drops like a tired marathon runner. Real-time monitoring allows you to catch stress at the first sign of trouble rather than at the collapse.
Linux provides you with powerful native tools that feel almost unfair in their simplicity. No heavy dashboards are needed in addition. No complex agents at that. Just direct visibility into what your machine is doing at this exact moment. Your server ceases to be a mystery when you understand these tools. It also begins to behave like a predictable machine.
Easy Linux Server Monitoring is just Ultahost Away!
Monitoring Linux servers can be a pain in the back. Ultahost’s professional aid and proactive solutions can help you out with any relevant query. Join us now for practical tips regarding your servers and hosting.
Linux server monitoring is the practice of observing all crucial activities of your machine.
The most basic command is top. Type it to transform your terminal into a live control room. You see:
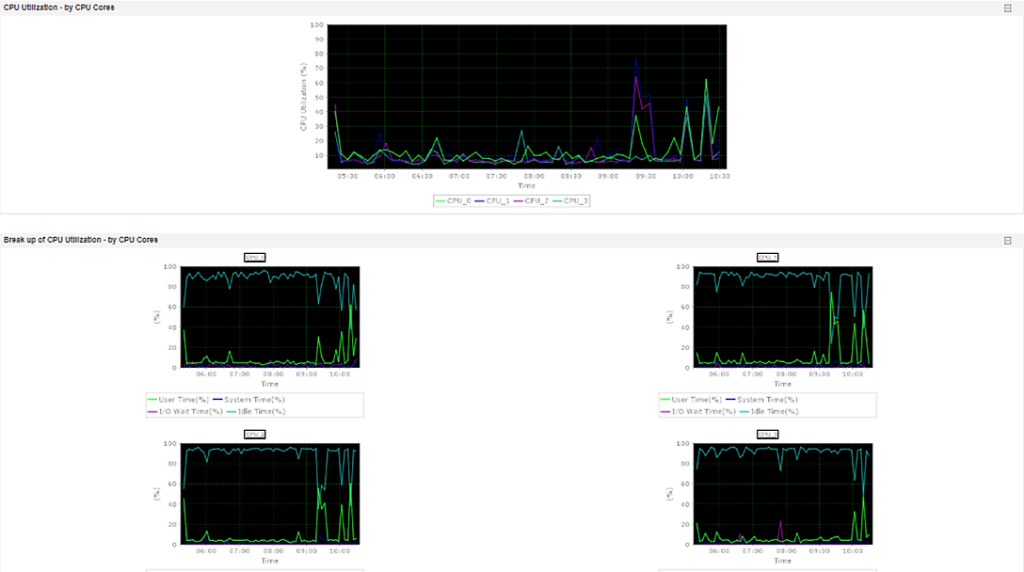
The htop is another fan favourite. It shares similar information but in a cleaner layout. It shows CPU cores as individual bars. Easier this way to see the imbalance. You know your application might have a single thread when one core is overloaded, as others are unfunctional.
The vmstat provides insight for deeper inspection. It tells you if your system waits on input and output or if the CPU is just spending time. This command helps you separate a CPU problem from a disk bottleneck.
Linux server monitoring is pattern recognition. A healthy server has rhythm. You look into the matter when that rhythm changes.
Linux server monitoring covers multiple aspects of your machine. Let us explore each of them in detail for further clarification.
CPU usage monitoring informs you how much of your processing power is consumed and by whom. In top, you will see:
Your applications are busy if user space usage is high. The kernel is doing heavy work if system usage climbs. The CPU is waiting on disk or network operations if wait time rises. That is not a processor problem.
The uptime command gives you a quick snapshot. The load average values go over one or five or fifteen minutes. Load average represents the number of processes that await CPU time. A load average of four means full utilization on a machine of four cores. A load of eight means processes are queuing.
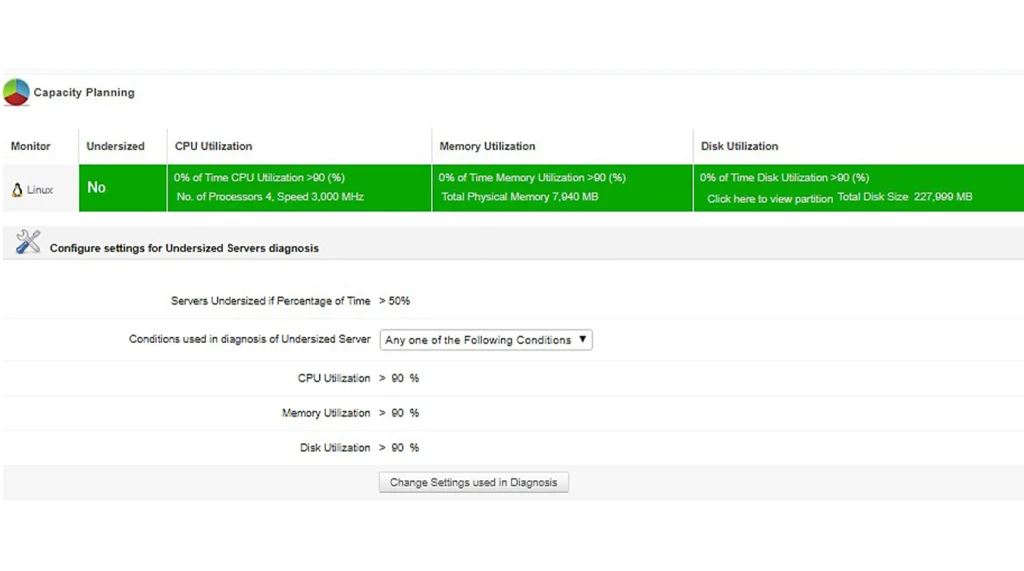
Context matters here. A load average of six on an eight core server is fine. The same number on a machine of dual cores signals strain. CPU usage monitoring compares numbers to capacity.
The mpstat command adds another layer by breaking CPU usage down per core. This helps you identify imbalances and thread limitations in applications. Your Linux server performance ceiling is lower than you think when one core works at full capacity while others rest.
RAM usage is often misunderstood. People see high memory consumption and assume danger. Reality is that Linux uses available memory to improve speed for caching. Free memory is wasted memory from the kernel perspective.
The free command shows:
Monitoring RAM usage shows growth trends. Memory climbs during peak hours and drops after traffic decreases. That is normal behavior. Something is wrong if it climbs and never returns.
Load average deserves special respect because it reflects overall system pressure. It also measures how many tasks run or wait for the CPU. It measures demand and does not measure percentage.
Check load average with uptime or top. You will see three numbers.
You have a recent spike if the first number is much higher than the others. The load is sustained too when all three are high as a result.
High load average with low CPU usage can confuse new administrators. This often means processes are waiting on disk input and output. Use iostat to check disk activity.
Furthermore, you can find additional info on our server support service.
System performance is not a single metric. It is the balance between the processor and memory and disk and network. Real-time monitoring also helps you see where an imbalance occurs.
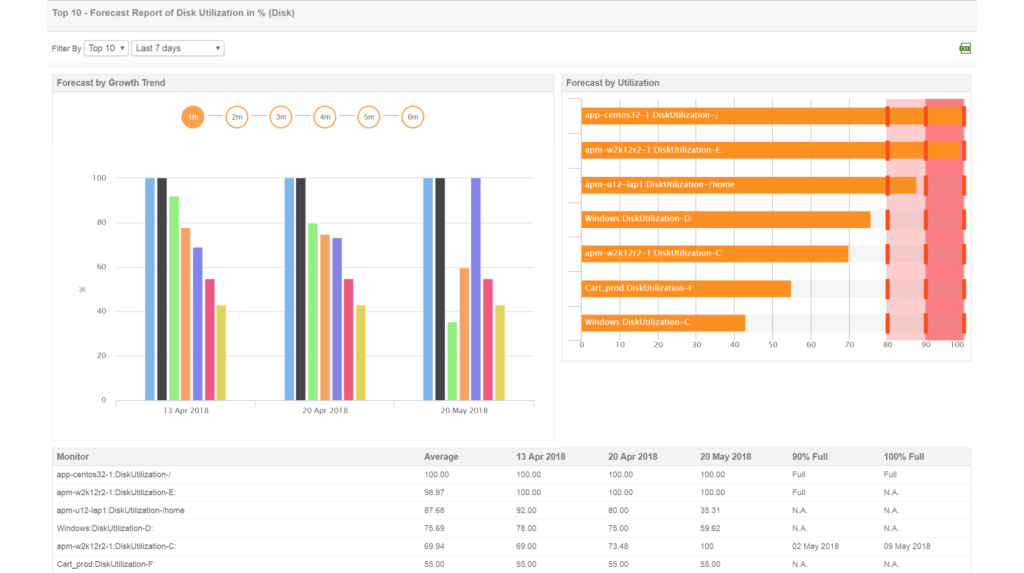
The sar command collects and reports system activity data. It provides historical insight if enabled. This helps you compare current performance to previous patterns. You dig deep when today looks different from yesterday under similar traffic.
Tools like atop also help correlate events. A traffic spike leads to CPU growth, too. That leads to a higher load average, which further leads to memory pressure. Watching this chain in real time sharpens your instinct.
Linux server monitoring is a strategy builder. A checkup of the whole performance of your machine saves you trouble and gives you the security edge. Monitoring also lets you prevent failures before they mess you up beyond recovery. High visibility paired with a reliable foundation keeps your servers stable under pressure as a result. Those decisions become even easier when your infrastructure runs on solid hosting backed by Ultahost. Remember that strong foundations amplify smart monitoring despite challenges.
UltaAI – Smart AI Assistant for Ultahost Clients
UltaAI is your advisor for anything related to domain or hosting. Experience personalized suggestions with our Smart AI!